The Power of Real-Time Monitoring, Live Tail, and Smart Alerts with LynxTrac
Experience how LynxTrac delivers real-time monitoring, Live Tail log streaming, and instant alerts — including email, chat, and SMS — to help IT teams detect and resolve issues before downtime occurs.
SERVER MONITORINGLOG ANALYSISRMM
10/29/20252 min read
💡 Why Real-Time Monitoring Matters
Traditional monitoring often relies on periodic polling — data collected every few minutes.
But in dynamic environments, that’s simply not enough.
A spike in CPU usage or a critical service crash can happen in seconds.
LynxTrac’s event-driven telemetry engine streams metrics live from each endpoint, giving you instant feedback and actionable alerts.
You don’t just see what’s already happened — you see what’s happening now.
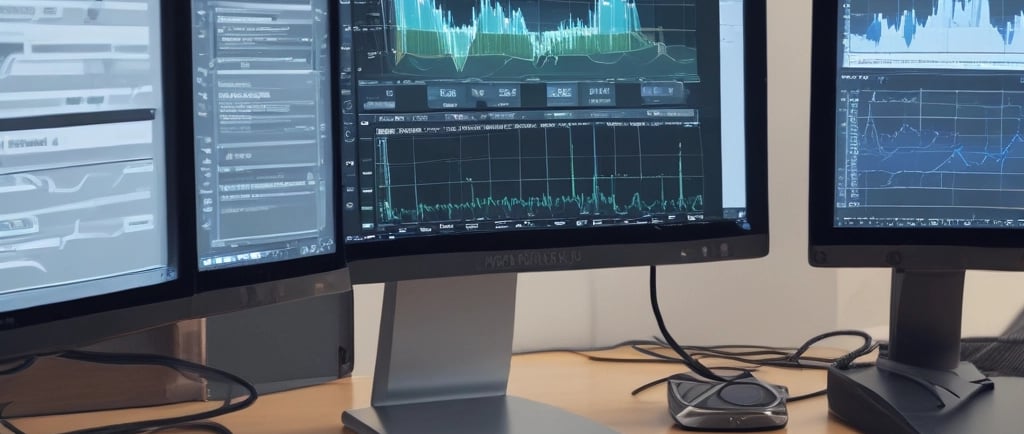
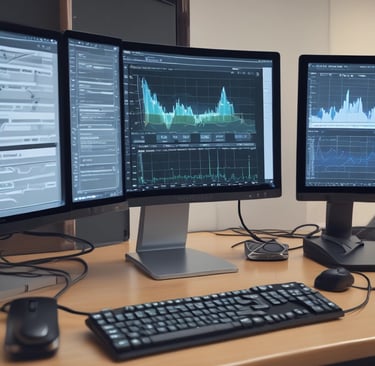
⚙️ 1. Unified Dashboard for Complete Visibility
LynxTrac’s real-time dashboard gives you a clear overview of your entire environment:
CPU, memory, disk, GPU, and network utilization
Active users, running processes, and uptime
Device health and connectivity status
Alerts, warnings, and recent changes
Every metric updates automatically — no manual refresh, no lag.
The result is a living dashboard that reflects the true state of your systems at all times.
📜 2. Log Insights That Tell the Full Story
Monitoring shows what is happening. Logs reveal why.
LynxTrac’s centralized log analysis engine aggregates logs from all endpoints and applications into one searchable interface:
🧠 Filter by device, event type, or keyword
⚠️ Highlight errors, warnings, or anomalies
🕵️ Identify performance patterns or security issues
📤 Export reports for compliance or audits
And with Live Tail, you can stream logs in real time — just like watching a live feed of your systems.
It’s perfect for troubleshooting critical events, observing active processes, or verifying recent configuration changes without switching contexts.
You can diagnose problems faster than ever — without SSH-ing into individual machines or juggling multiple tools.
🚨 3. Intelligent Alerts & Notifications
LynxTrac allows you to define custom alert thresholds for system metrics and events.
If CPU usage spikes, memory runs low, or a key service fails — you’ll know immediately.
Notifications can be sent via:
📧 Email alerts
💬 Chat integrations (Slack, Teams, etc.)
📱 Text/SMS alerts for critical issues
🖥️ Web dashboard notifications
With real-time alerting across multiple channels, downtime becomes predictable — not surprising.
🔄 4. Correlation Between Metrics and Logs
The real power of LynxTrac lies in correlating monitoring data with log insights.
When an alert is triggered, you can instantly view related logs to pinpoint the cause.
For example:
High CPU alert → Log shows backup service stuck in loop.
Disk space warning → Log shows temporary cache accumulation.
This context-driven approach eliminates guesswork and speeds up resolution dramatically.
🔐 5. Designed for Scale and Security
LynxTrac’s monitoring and logging systems are built for enterprise scale:
Event-driven streaming handles millions of updates per minute.
Secure data transmission ensures logs and metrics are encrypted end-to-end.
Retention policies let you control storage, ensuring performance and compliance.
Whether you manage 10 endpoints or 10,000, LynxTrac keeps your insight sharp and your data safe.
🌍 From Visibility to Predictability
We’re taking monitoring one step further — toward predictive intelligence.
Our upcoming roadmap includes:
AI-assisted anomaly detection
Automated response workflows
Trend-based forecasting
Soon, LynxTrac won’t just tell you when something goes wrong — it’ll tell you before it happens.
✨ See It in Action
Experience how real-time visibility, Live Tail log streaming, and multi-channel alerts can transform your IT operations.
Visit lynxtrac.com to explore how LynxTrac delivers instant clarity across every endpoint.
Contact Us
© 2025 LynxTrac. All rights reserved.
We respect your privacy. No spam — ever.